We’re finally tackling a UI for Data Pipeline. Over the next few weeks, we’ll be drawing up plans and working on the first iteration/MVP (Minimum Viable Product) of Data Pipeline Builder, our online code generator.
Since Data Pipeline lives inside your products and applications, a server product – to run your pipelines – probably wouldn’t be too useful. Instead, we’ll create a GUI for you to design pipelines, generate code, and plug that code into your software.
Your Top 3 Features
What are the top 3 features you’d like to have? Our goal with the MVP (and this blog) is to get your feedback ASAP. Please take a look at the mock-ups below and give us your thoughts. If you have feature requests or think we’re headed in the right direction, please let us know. If you think we’re on the wrong course, we’d like to hear that too.
The first iteration will focus on a couple, common transformations: select fields and rename fields. It’ll also include JDBC input and output types to round things out. The plan going forward is to focus more on the middle step (data transformations, processing, filtering, etc.) where a lot of Data Pipeline’s value lives.
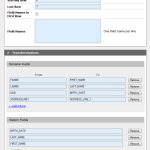
Option 1 – A Single Page
At first we were thinking “keep it simple”. No crazy graph designer, just a couple dynamic pages. The first page — the designer — would have 3 sections: input, transformations, and output.
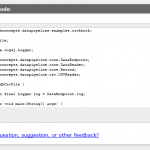
The second page would present the generated code for the developer to copy and paste.
Scratch option 1. A single, long page could get overwhelming. And having too many elements on the one page would be confusing. Also, most people probably aren’t using a 27 or 30 inch monitor. Even a monitor with 1080 lines would still cut off a good chunk of the screen.
Option 2 – A Web-based Wizard
Our current thinking is to start with a simple wizard. If at some point we need a more advanced designer — like a node-edge assembler — we’ll revisit it then. At that point we could always keep the wizard for most users and give the kitchen sink option to advanced users.
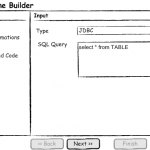
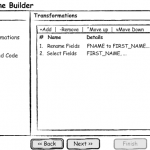
The wizard we’re planning will have 4 main pages — one for each of the original panels above, plus the generated code.
Page 1 — Select and configure the input. The controls for this page will change depending on the type of input (JDBC, CSV, XML, etc.) selected. We’ll also include a generic option where the developer can later code in their DataReader.
Page 2 — Add and and configure transformations. On this page, developers can add, remove, edit, and reorder transformations. We considered using a formatted card list for the transformations, but decided a grid would offer better structure along with consistent placement and labels. The individual transformation editors will be presented in pop-up, modal dialogs.
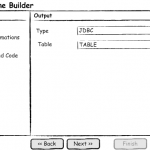
Page 3 — Select and configure the output. Like the input page, the controls on this page will change depending on the type of output selected.
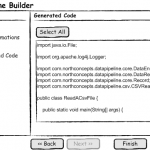
Page 4 — View and copy the generated code. This page assembles the data from the first three pages and generates the appropriate Data Pipeline code.
Now you know our plans, let us know what you think. Thanks.
(Want to know more about Data Pipeline Builder?)

